


What Does HPLC Purity Actually Measure?
Analytical Testing
What Does HPLC Purity Actually Measure?
A sharp chromatographic peak is only the beginning. Discover how separation, detection and integration produce the percentage on a peptide report.
A laboratory reference. No dosing or administration guidance.
HPLC area purity is the target peak’s share of the included chromatographic signal under a stated method. It tells you how that signal is distributed. Understanding the separation, detector and calculation explains both the value of the number and its limits.
A certificate shows one tall, narrow peak and a purity result above 99%. It looks reassuring. For a researcher, though, the interesting question is what the instrument counted to produce that percentage.
The answer begins with the chromatogram. It is a record of detector response over time, not a photograph of everything inside the vial. Learning to read that record makes the purity figure more informative and helps explain why it belongs alongside identity and content results.
Follow the sample through the column
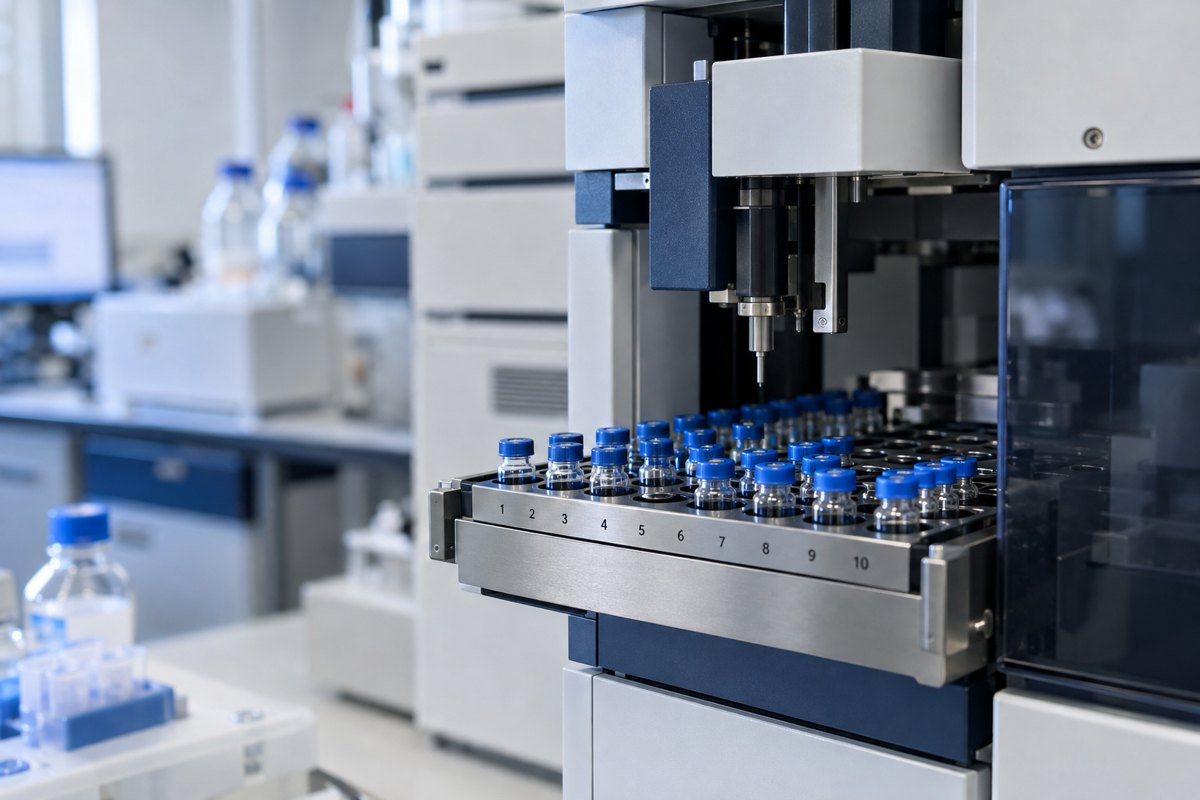
HPLC combines a separation with a measurement. Constituents pass through a column, interacting differently with the stationary and mobile phases. Those resolved by the method reach the detector at different times.
For reversed-phase peptide chromatography, the mobile-phase conditions, gradient and other method choices influence retention and separation. Mant and colleagues’ methodological account explains these relationships and the different chromatographic approaches available for peptides. There is no single set of HPLC conditions that defines every purity result. Mant et al.: HPLC analysis and purification of peptides.
On the resulting trace, a peak is a period of increased detector response. Integration gives it an area by applying a baseline and the method’s processing rules. The laboratory then assigns peaks and decides which areas belong in the reported calculation.
The percentage is a calculation with a denominator
In an area-normalisation result, the assigned target area is divided by the total included area and multiplied by 100. The denominator is as important as the target peak. An excluded signal, an integration threshold or an unresolved contribution changes what the calculation describes.
A chromatogram is a detector signal
Resolved components elute at different times.
The method assigns areas to selected peaks.
The denominator and detection conditions matter.
Illustrative trace only. It contains no experimental batch data or calculated purity result.
What the detector sees is not everything the material contains
A peptide material’s composition can include water, counterions and residual solvents. These contributions are not necessarily represented in a routine peptide UV area-purity calculation. A high area percentage and a lower peptide fraction by weight can therefore describe different aspects of the same material.
The NIST-hosted IUPAC technical report on organic purity assignment discusses mass-balance and quantitative approaches, including impurity contributions and uncertainty. That broader assignment is a different analytical task from expressing one peak as a proportion of a chromatogram. NIST/IUPAC: organic-purity value assignment.
This becomes especially relevant when a researcher needs a defined amount for a quantitative experiment. The chromatogram can help characterise the distribution of detected species, while a calibrated content measurement addresses the amount of the intended analyte.
A large peak still needs an identity
Peak size and peak assignment are separate ideas. A dominant signal could belong to the intended peptide, an unexpected species or unresolved contributions. The label attached to that peak needs supporting analytical evidence.
Coelution is the particularly useful concept here: constituents that the procedure does not resolve can contribute within the same peak. A tidy-looking trace does not make this question disappear. The relevant issue is whether the method can distinguish the species important to the analysis.
ICH Q2(R2) treats identity, assay and impurity measurement as distinct analytical purposes, with validation characteristics such as selectivity, accuracy and precision assessed for the intended task. This pharmaceutical-method guideline provides a useful framework for understanding measurement performance; it does not assign pharmaceutical status to a research reagent. ICH Q2(R2): validation of analytical procedures.
Two reports can agree without answering the same question
Consider two invented reports, both giving 99.1% area purity. Report A includes a trace and method reference. Report B also identifies the target peak, supplies separate identity evidence and reports a calibrated content value.
For a quantitative calibration study, Report B supplies information missing from Report A. That does not establish that its material is superior. It establishes that the documentation answers more of the researcher’s questions.
Now change the task. The researcher is examining an impurity profile before and after a laboratory stress experiment. The comparison needs compatible analytical and processing conditions. A difference between the percentages is difficult to interpret if one run includes a small shoulder in the target peak and another integrates it separately.
| Detail | Why it helps |
|---|---|
| Method reference | Connects the result with the procedure used |
| Detector conditions | Explains how the observed signal was obtained |
| Peak assignment and integration | Shows what was counted as target and what entered the total |
| Reporting basis | Distinguishes area normalisation from a calibrated assay |
Read the precision without overreading it
A result of 99.3% is numerically larger than 99.0%. Whether that difference is meaningful depends on the measurement context. Extra decimal places make a report more detailed; they do not, by themselves, demonstrate greater accuracy or a better material.
Similarly, a reported 100% can mean that no additional included peaks exceeded the procedure’s reporting threshold. It is still a method-bounded observation. The most useful description stays close to that observation: HPLC area purity under the named procedure, with the original trace available for interpretation.
What to take from the chromatogram
- Area purity describes a share of included detector response.
- Separation and peak assignment give that share its meaning.
- Composition by weight and peptide content require their own reporting basis.
- Comparable methods make comparisons between percentages more informative.
Sources and reading
Laboratory scope: This article concerns chromatographic interpretation for research. A purity percentage does not establish suitability for human or veterinary use.